Visualizing Race Progression
As in any sport, understanding progress and athletic development is the cornerstone of your development programme. That is exactly why we include detailed graphs at Trackaswim. These visual tools help swimmers, coaches, and parents understand the progress of their swimmers quickly and easily over a period of time. With the help of these tools, training programmes can be put together to help the swimmer in their progress.
The below breakdown of the graphs and what they show will help you understand how Trackaswim is used as a key too for any swimmer.
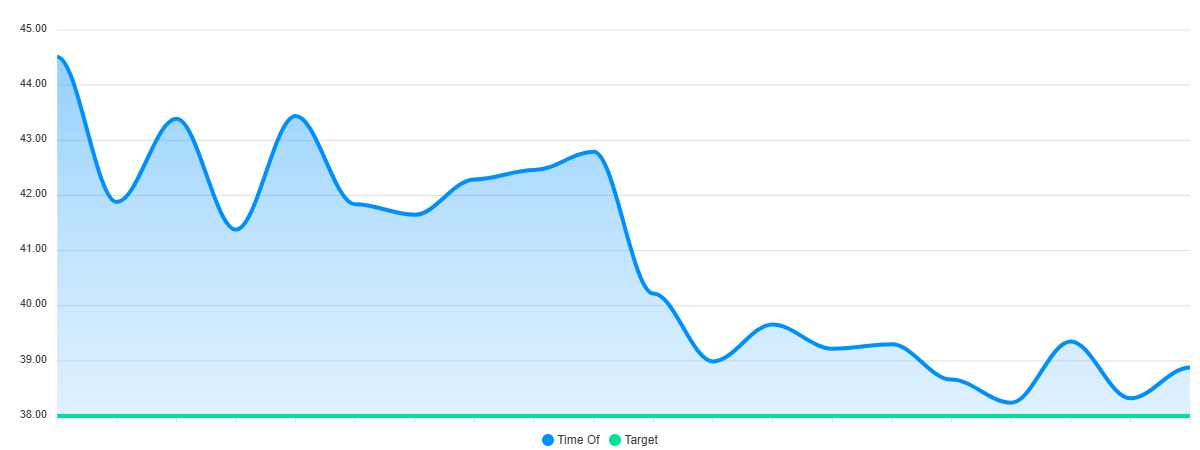
The main graph we use at Trackaswim is a simple line graph that plots your progress on a specific stroke.

The graph above is a typical example of a swimmers progress over a period of time. Not every race will be an improvement on their last time, but over a period of time there should be a steady progressive downward chart. In the chart above, this is the progress of a young swimmer over an 18month period for the 50m Backstroke. The chart shows a steady increase in the swimmers progress. Its important to understand that not every race will be an improvement on the last race. Times will fluctuate up and down over time but there should be an indication that times are getting better.
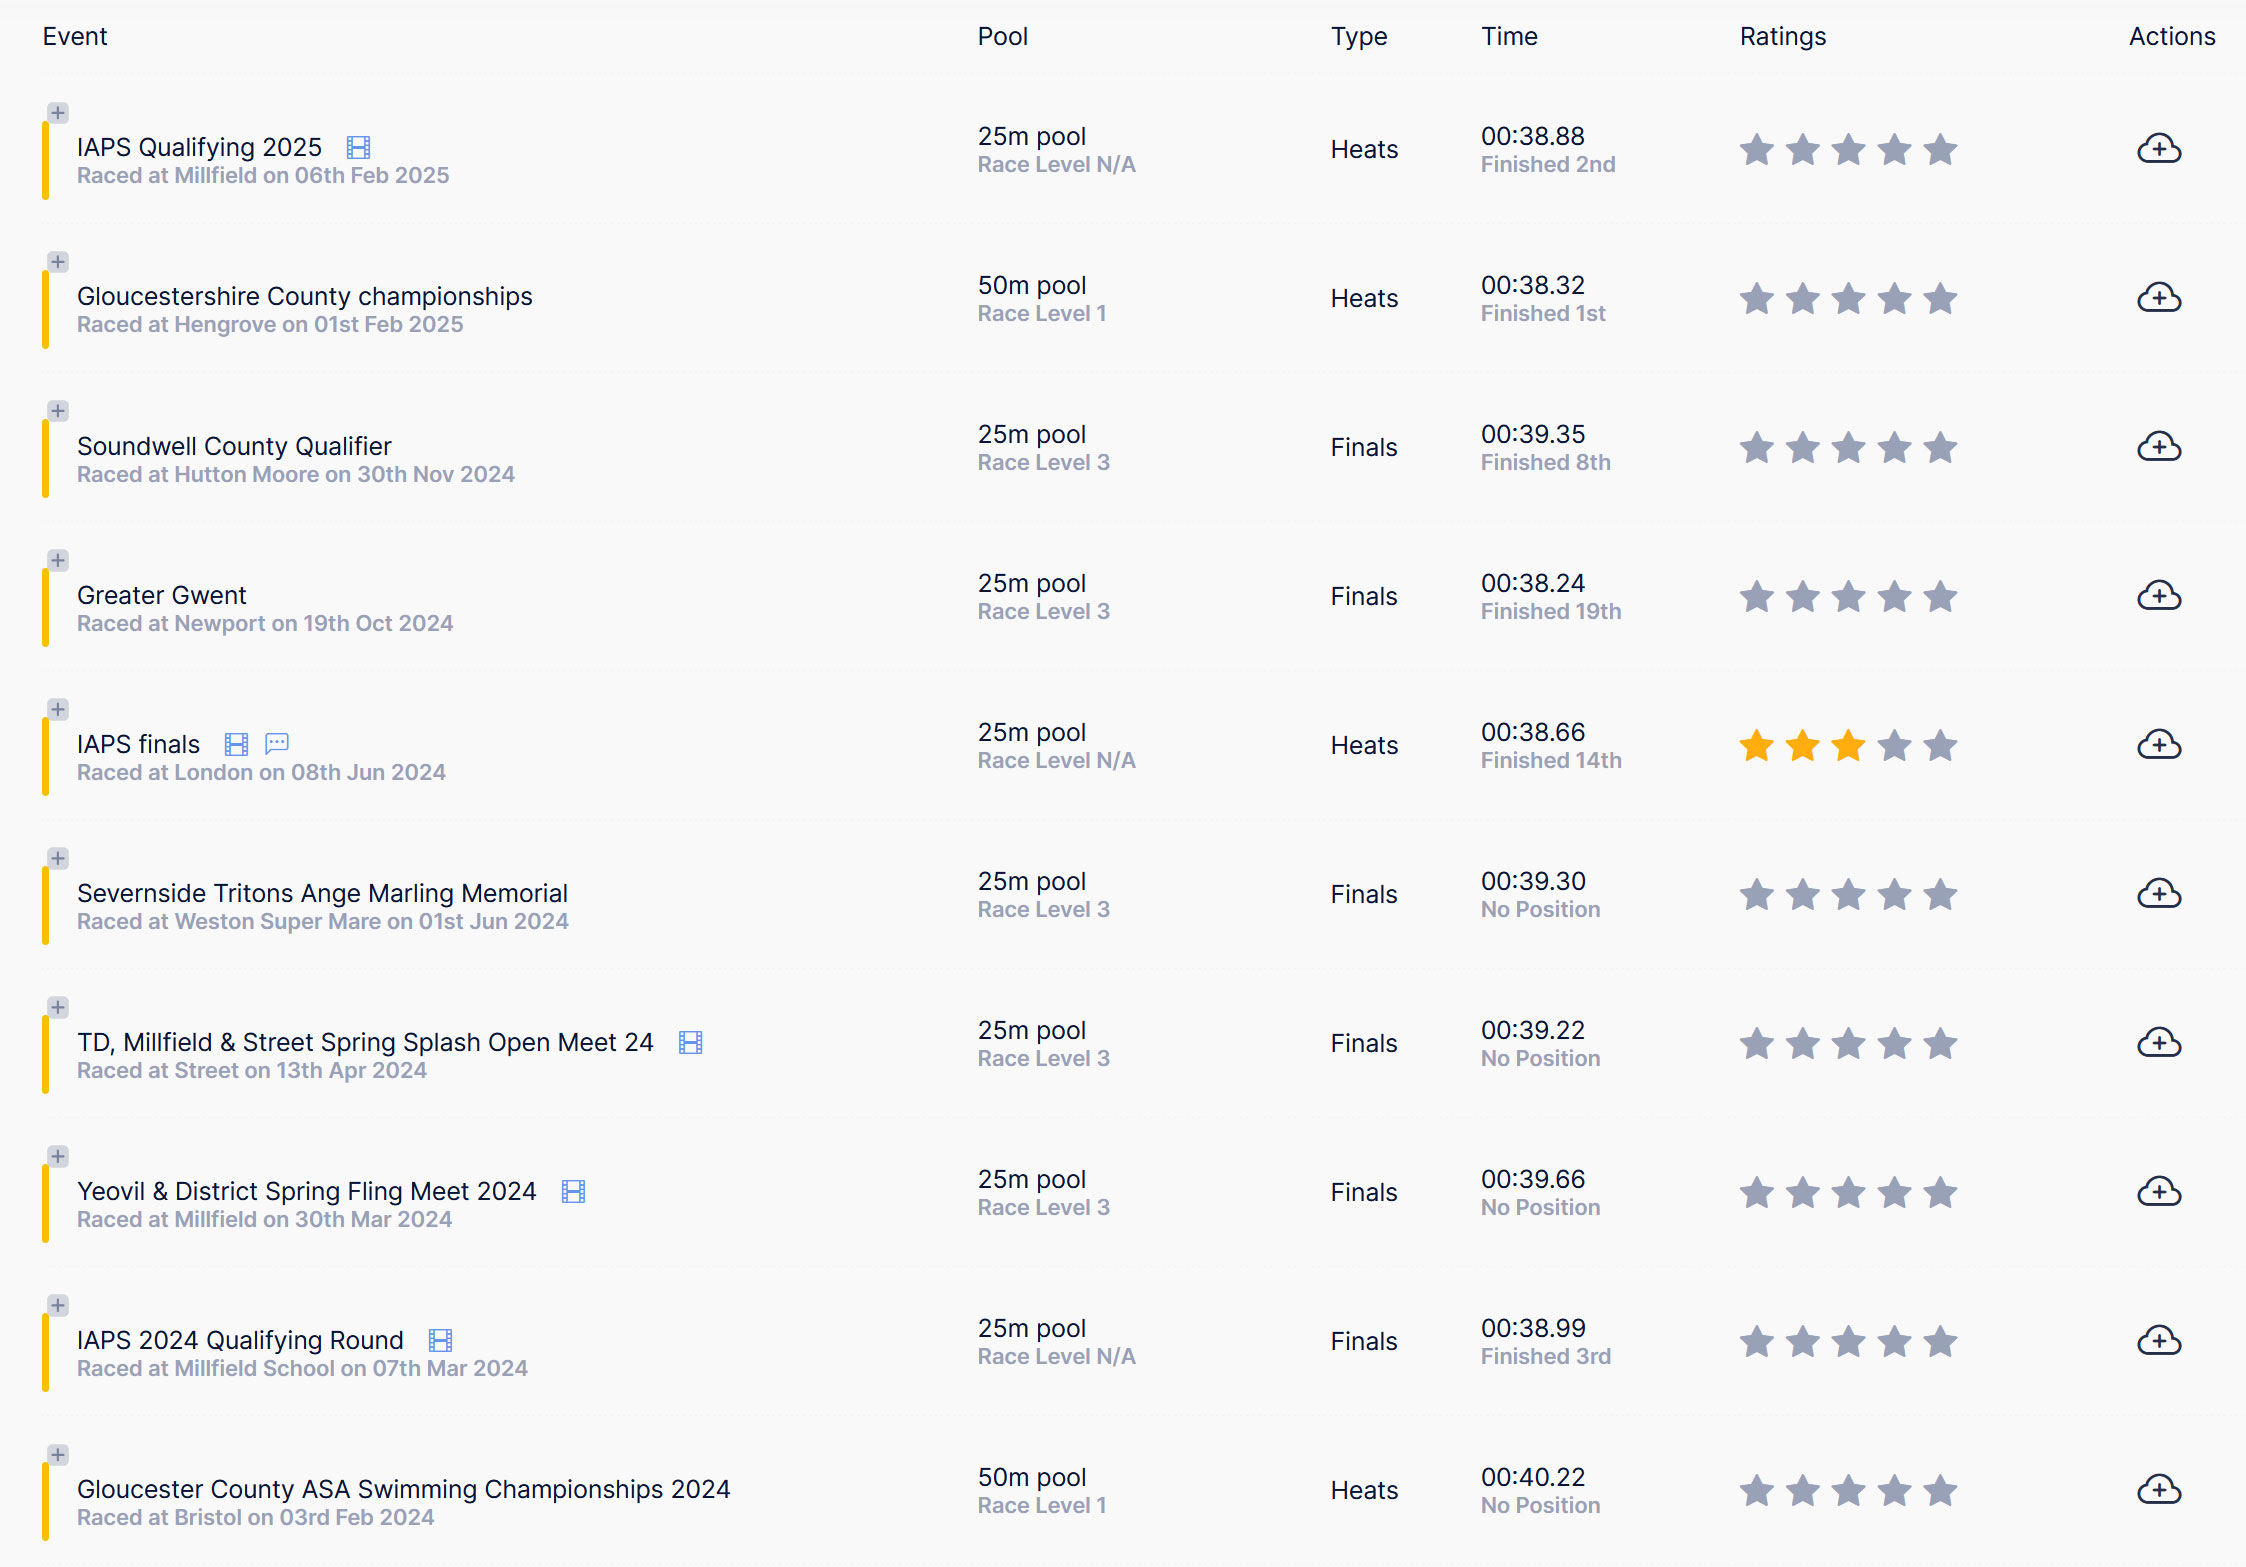
Along with the visual graphs, we always show the raw data that is used to create the visual graphs. This data is what is entered into our database, either by the swimmers or from meets and galas. By having the raw data available to review aswell as the visual graphs will help identify any areas that may need attention. By analysing the data overall it may be that a certain pool is where you perform best. It may identify that a specific training schedule that the coaches have been working on is showing to have worked well for you.
Having all of this information available can easily help you understand the progress of the swimmer. If there is good consistent progress in times then this could indicate that the training programme is very effective, while a sudden decline in times could indicate over training and fatigue or that there is a need for technique adjustments .Recognising these patterns early will help keep progress on track.

Getting the most from your graphs
Below are some quick tips on how to get the best from the data graphs and tables.
Benefits of this graph:
-
Easy trend analysis – Quickly see whether you’re trending faster or slower across meets. Zoom into the graphs to analyse a specific time period.
-
Compare across events – Different locations, pools will give you different times. Filter by a specific location and understand which location brings out the best in you.
-
Identify training impact – Pinpoint periods where improvements aligned with specific training plans. Different training schedules and sessions can change how you swim.
-
Improved memory recall – Check performance metrics on how you felt on race day. Your mental preparation is just as important as physical. Ensure your head is also ready for racing.
-
Performance dips after breaks – Did holidays or illness correlate with slower times? Did missing training session impact on your performance?
-
Improvement surges – Spot big jumps after high-volume training periods. A change in coach or even just a change in attitude in training can impact on races.
-
Plateaus – Identify long stretches without time drops, signaling the need for change. This can prompt a conversation with your head coach to see what can be changed if needed.
-
Visual motivation – Watching yourself get closer to a goal is incredibly encouraging. Add a goal to your stroke to help you drive forward and achieve your times.
-
Data-driven decision making – If you’re not trending toward your goal, adjust early. Keep analysing and keep adjusting o ensure you find a routine that works.
-
Spot technical weak points – If your rating is low on starts and your time lags, it’s a fixable issue. By using our race reviews, you can pinpoint areas of your stroke that can get you those extra few milliseconds that will make a big difference overall.
-
Better coach conversations – Use your feedback to guide coaching strategy. Coaches can have a huge impact on both mental and physical preparation. Use them!
Our performance graphs are more than just visual guides, when used properly they are extremely powerful tools for coaches and swimmers. Use them often, study them together with your coach and watch your times improve.


